The Consumption Baseline: Why Half-Hourly Data Should Come Before Capital
Somewhere in your building, equipment is running through the night and the weekend that doesn't need to be left on. The grid connection has a supply capacity much higher than the actual peak the site has drawn in years. A business looking for a way to reduce energy cost likely has a solar quote sitting on someone's desk, sized to its roof rather than to the way the business or public authority actually consumes energy. The monthly bill lists the costs by tariff, demand and standing charges. The real opportunity to understand the consumption pattern of a business is not found on a monthly bill. It's right there in the electrical meter, continually recording how much energy is imported every 30 minutes.
Reading the half-hourly meter data is the first step in any energy project, before a solar panel, a battery or a heat pump is selected. Using the half-hourly data to understand the consumption profile, seeing the changes between day and night along with seasonal differences, needs to happen before any low carbon technology is considered. The half-hourly meter data should be the foundation of an investment case a business can actually rely on with confidence. In reality, a business sets out with good intentions to cut the cost of energy bills, quotes come through from the installers, a company is selected and the installation completed. Both the quote and the returns on investment are built on the monthly electrical bills. The twelve months of half-hourly data that would truly stress test the investment case is ignored. That data is readily available from the utility supplying the business or public authority, and using the meter data is the foundation that ensures the highest return on investment in any energy project.
What Procurement Cannot Fix
UK businesses pay somewhere around 24p to 26p per kWh for electricity, with DESNZ putting the average across all non-domestic users at 24.3p in mid-2025. The wholesale cost of the power, the part that gets quoted in the headlines, is often less than half of that. The rest is non-commodity charges for moving electricity across the network, balancing the system, funding capacity and paying for policy, and those charges are rising faster than the commodity itself. A better contract does not protect against any of it. Using less, and using it at the right time, does, and that is a question the meter answers and a tariff comparison never will.
The Data a Business Already Generates
Half-hourly metering records consumption every 30 minutes. That is 17,520 readings across a year, where an older profile-class meter sits behind a handful of estimated figures, so the half-hourly record shows what the site actually did rather than an estimate of it.
That data is about to become universal. Every electricity meter in Great Britain is moving onto half-hourly settlement under a programme run by Elexon for Ofgem. Migration began in October 2025 and runs to May 2027, with the new settlement model taking effect in July 2027. The practical effect is that the cost of when power is used, not only how much, gets sharper and harder to ignore. The government's Clean Power 2030 Action Plan treats half-hourly settlement as a critical enabler of flexibility, so understanding the consumption profile of a business creates more value, not less.
What the Profile Actually Tells You
A year of half-hourly data is not a spreadsheet to file. It answers commercial questions a tariff comparison never will, and two of them decide more than the rest.
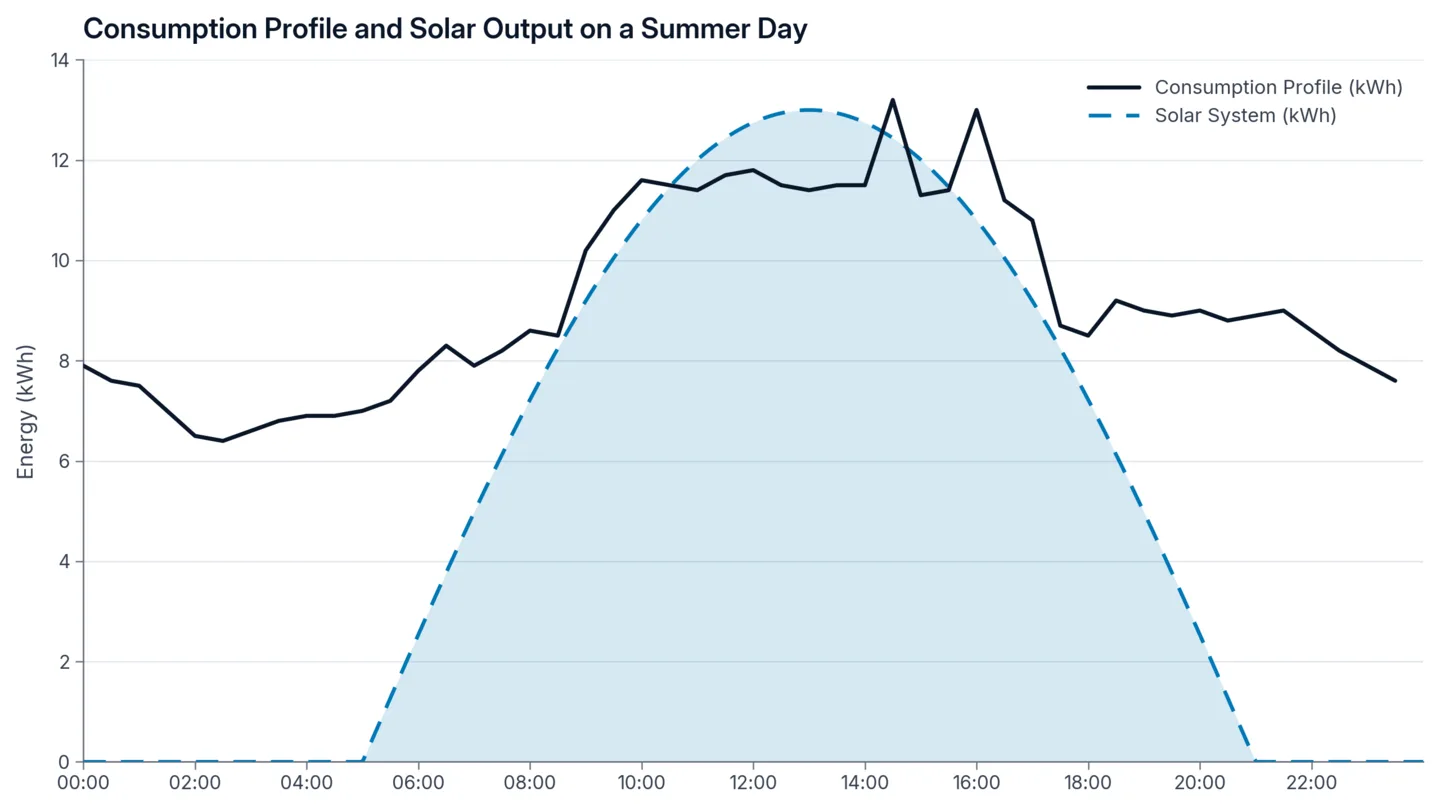
The first thing revealed in the meter data is how demand is spread across the day. This influences the design options and low carbon technology systems that can be deployed. A warehouse running long day shifts has a profile that tracks solar generation almost hour for hour, so most of what a roof array makes gets used on site. A site that does its real work after dark does not, and no amount of roof space changes that. Whether solar, battery storage or load-shifting fits a site is written into this curve, and it cannot be read off a monthly total. It only appears at half-hourly resolution.
The second is the site's agreed capacity. A site pays for the capacity it has agreed with its network operator, in kVA, whether it draws that capacity or not. Plenty of sites carry a ceiling they last came near years ago, often set when the building did something it no longer does. A site sitting well below its agreed capacity can usually reduce it, save in the region of £10,000 a year for a larger site, and sometimes drop into a lower charging band as well. The exact figure depends on the site and the operator. The data shows the headroom in an afternoon, and the saving needs no capital.
Underneath those two, the same dataset surfaces a handful of smaller things worth money. Every site has a base load, the floor below which consumption never drops, and a surprising amount of it is usually equipment left running overnight that nobody chose to leave on. The relationship between average demand and peak, the load factor, shows whether the site is paying for short sharp spikes that could be flattened by staggering start-up, often for nothing. On certain metering arrangements a poor power factor inflates the site's measured demand and attracts a charge that correction pays back quickly. And distribution charges still vary by time of day, with the priciest window on weekday late afternoons, so shifting flexible load out of it saves money too. The opportunities to reduce energy cost can be found in the half-hourly meter data.
Why the Baseline Decides the Technology
Take the consumption profile and follow it into a decision a business is considering, a rooftop solar proposal. Self-consumption is the single biggest driver of whether that project is worth the investment. The half-hourly profile is the only thing that truly reveals the financial benefit to a business once a low carbon technology system is designed and modelled.
The logic is simple. Power used on site as it's generated displaces electricity the business would have bought at 25p per kWh or more. Power that can't be used at the moment it's made gets exported, and export earns a fraction of that, with some commercial rates as low as 8p to 9p per kWh against premium rates near 15p per kWh. So the same solar panel is worth two or three times as much when its output is consumed on site behind the meter as when it is exported to the grid. A system sized to fill the available roof generates plenty but sells a large share of it back cheaply, whereas a system sized to match the site's load keeps that value on site. Those are very different investments, and only one is built around how the site actually runs.
The gap is large enough to decide the case on its own. A daytime operation might use 70% or more of what its panels generate. A poorly matched site might use a third. At 25p per kWh of displaced grid cost against 9p per kWh of export, that's the difference between a project that has payback period of 3 to 5 years and one that takes more than a decade to see a return. The opportunities cannot be fully realised without a year of half-hourly consumption sitting under the design. A solar proposal built without that overlay is not a design but a quote, sized to the roof because the roof is the easy thing to measure.
Monthly data gets nowhere on the number that matters most. A monthly total shows roughly how much a system might generate across a year. It cannot show how much of that generation the site will actually use, which is the number the entire return depends on. Get self-consumption wrong by 20% in the design stage and the payback on the investment approved by the company board or finance team is compromised. The half-hourly meter data profile is what turns a generation estimate into an investment-grade case, with a self-consumption figure that can be defended and a payback that survives scrutiny.
The same data protects a site on the way into electrification. Adding EV charging or a heat pump without checking the available headroom can push a site past its agreed capacity, which means excess charges at best and a reinforcement bill at worst. The profile shows whether the capacity is there, and whether moving charging into the small hours keeps the site under the ceiling. Same principle as the solar case: the design follows the data, not the other way round.
The Wins That Come Before Capital
An assessment completed on the same half-hourly dataset pays its way before anything is built at all. The Carbon Trust has held the same line for years: good housekeeping, better controls and a little staff engagement take around 10% off a typical energy bill at little or no capital cost. Assessments under the Energy Savings Opportunity Scheme tend to bear that out, with most of the savings they identify coming from low-cost operational changes rather than big installs.
Correctly matching the agreed capacity, confirming the maximum demand, rescheduling to flatten a peak: none of it needs a solar panel, a battery or a heat pump, and all of it is clearly seen in the half-hourly data. Realising these opportunities matters twice. Energy cost can be reduced now, and future low carbon technology is sized against a better-understood load profile, which makes that investment case stronger too.
The Public Sector Has the Same Problem, with More Scrutiny
Councils, NHS trusts and universities face the same question with an extra layer of accountability attached. The Public Sector Decarbonisation Scheme, delivered by Salix, now expects evidenced baselines and credible heat decarbonisation plans rather than applications filed on a first-come basis. The Greening Government Commitments rest on measured baselines too. For a public body the consumption baseline is not only good practice. It is the audit trail that justifies spending public money and the thing that survives committee scrutiny when the business case is challenged.
How Tipio Energy Approaches This
We start with the data, not with a pre-set answer. The Energy Baseline and Opportunities Review takes a year of half-hourly consumption, tariff history and supply agreements, and turns them into a clear picture of where the money goes and what would change it.
We separate the operational wins that cost nothing from the measures that need capital. Any technology is sized against the site's actual load rather than a generic assumption, with self-consumption, payback and the effect on agreed capacity modelled before anyone mentions procurement.
Because we do not sell panels, batteries, EV chargers or heat pumps, the baseline is the product. The data decides what is worth doing, not an installer's design team. We present it the way a board or a finance team needs to see it: clear numbers, clear assumptions, a clear route to whatever comes next.
Start with the Data
The order matters. Read the data, then decide what to build. A consumption baseline is essential. It informs the technology choice, and it separates a capital decision a business or public authority can defend from one it is hoping comes good.
Get a baseline and see where your energy spend is actually going before you commit a pound of capital.
More Insights
The Depot Charging Scheme: what £170m of UK funding will, and won't, pay for.
The Depot Charging Scheme has £170 million for UK fleet depots. The grant covers 70% of chargepoint and civils costs but not the grid connection, the vehicles, planning or design. Window two opens 28 October 2026.
Solar on Leased Buildings: What Landlords and Tenants Need to Get Right
Around 55% of UK commercial property by value is rented rather than owner-occupied. Solar on those buildings now works technically and commercially. What determines whether a project delivers is the lease, the funding route and the property structure underneath the panels.
Electric Fleets Need More Than Chargers. They Need an Energy Strategy.
Grid capacity is the first constraint for EV depot charging. But once you know what your grid position allows, the next question is how to design an energy system that makes fleet electrification work within those limits.